Menu
This is a great question! Interestingly, during the peak of the COVID pandemic when a lot of people were in lock-down or choosing to stay home, we did see a small dip in pollution and also a very, very slight change in the rate of warming. This was partly because there was a lot less travel by road and air, and so lower emissions of the greenhouse gases, particularly carbon dioxide. The COVID pandemic was a good example of how our actions locally can make some difference to climate change
On longer timescales than the COVID pandemic, there are two main ways that we can link pollution to global temperature change. The first is by using evidence from the past. For instance, ice cores from Antarctica and Greenland contain information about past temperature, and about many other aspects of the environment. This is because the ice encloses small bubbles of air that contain a sample of the atmosphere – from these it is possible to directly measure the past concentration of atmospheric gases, including the major greenhouse gases: carbon dioxide, methane and nitrous oxide. Records from ice cores and other sources show a close connection between carbon dioxide levels and global temperature. Importantly, there are no examples in the ice core record of a major increase in carbon dioxide that was not accompanied by an increase in temperature.
Global climate models are one of the main tools that scientists use to help understand how reducing pollution into the future might help reverse the increases in global temperature that we have seen over recent decades. Using these models, scientists can explore different scenarios (or future pathways) for reducing greenhouse gas emissions and understand how this will affect global temperature over the next 30 to 100 years. These models indicate that by reducing atmospheric pollution we can slow the rate of temperature increase and eventually reverse it.
This is an important question because it underlies what we know about the rate and level of current greenhouse gas emissions.
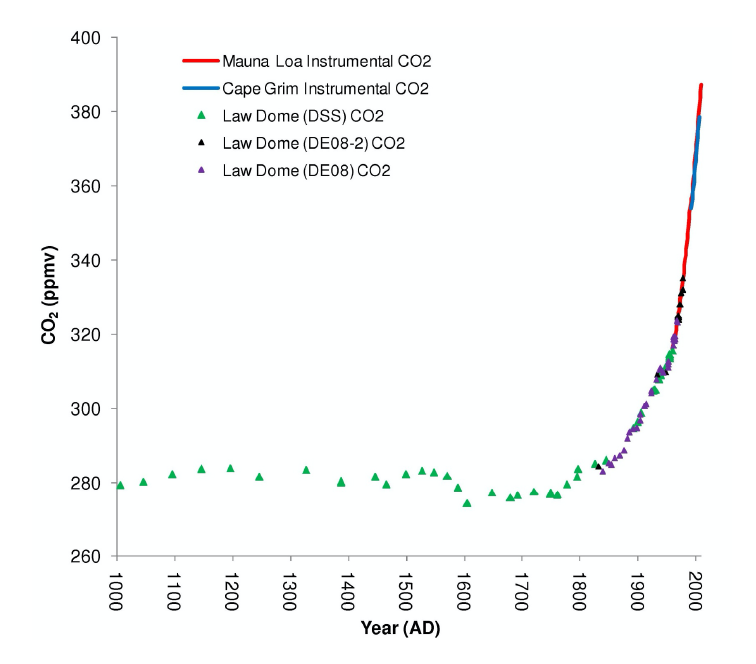
A lot of what we know comes from ice cores. Ice cores are excellent recorders of atmospheric gases like CO2. In the figure below (Figure 1) you can see measurements of CO2 based on gases collected from the atmosphere by specially made instruments(red and blue lines).These instruments have been used to monitor atmospheric concentrations since 1950 and the measurements align extremely well with what the ice cores from Antarctica are telling us. Therefore, we’re confident about what the ice cores say about CO2 concentrations hundreds, and thousands of years ago.
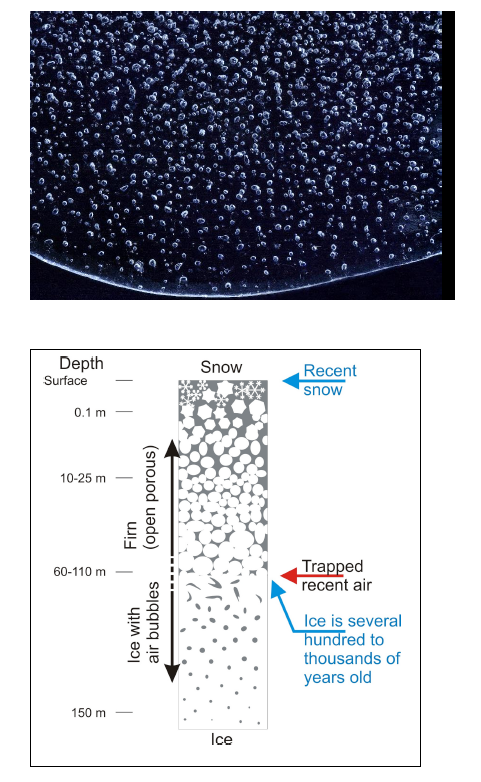
And how do we get CO2 concentration from ice cores? Ice has little bubbles of air in it.
These bubbles of air trapped in the ice core record what gases were in the atmosphere at
that time. As the next year’s snow falls, the older snow gets compacted, but the air bubbles
are still there. This process continues year after year, decade after decade, century after
century and so on.
Then an ice core scientist comes along and drills an ice core (long cylinder of ice) to collect
information about past climate from the ice. They use a lot of fancy machines to first work
out how old the ice is at points all the way down the core. They then extract the gases from
the air bubbles in the ice to work out what the gases are, and the quantities of different
gases along the core – from the youngest ice at the top all the way back to the oldest ice at
the bottom of the core. This provides a picture of how greenhouse gases have changed over
time.
Like making dinner, bushfires require some key ingredients. These are: (1) fuel, (2) fuel dryness, (3) ignitions and (4) fire weather.
Fuel means plants that can be burned. This includes grasses and shrubs, leaf litter and twigs, tree trunks, and really any other plant material.
For fires to occur, the fuel must be dry enough to catch on fire. If the plant material is still growing and therefore has water inside of it, it is more difficult for it to catch on fire. Likewise, if the fuel is moist because it has recently rained, then it is unlikely to catch on fire. This is one of the reasons bushfires are more common during summer, when it is warmer and dryer.
For a fire to occur, there also needs to be an ignition source. Ignitions are often accidentally caused by humans. For example, there have been ignitions caused by a people driving over a dry paddock and their hot exhaust pipe ignited long dry grass. There have also been examples when people failed to put out their camp fire. These human-caused ignitions are something that we humans have control over, and thankfully we seem to be getting better at managing them. There are also natural sources of ignitions, like dry lighting, which is lightning that occurs when it is not raining. Dry lightning unfortunately seems to be getting more common.
The final key ingredient of a bushfire is fire weather. Fire weather describes the type of weather that would cause a bushfire to start spreading. Bad fire weather consists of hot, dry, and windy weather occurring at the same time. When it is hot and windy, the fire can quickly go from a small fire to a raging bushfire. These are the days when fire bans are in full effect, which is why it’s so important for us to make sure we don’t provide any new ignitions on days when fires can spread easily.
Understanding past climates involves studying naturally occurring archives such as ice cores, tree rings and lake sediments, among others, from around the world including Tasmania and Antarctica. Each of these archives accumulate layers over time. This is similar to the pages of a book, where each page represents a particular period of time and each page tells you something different. Using many different chemical, geological, biological and physical methods, it is possible to reconstruct what the climate was like in the past.
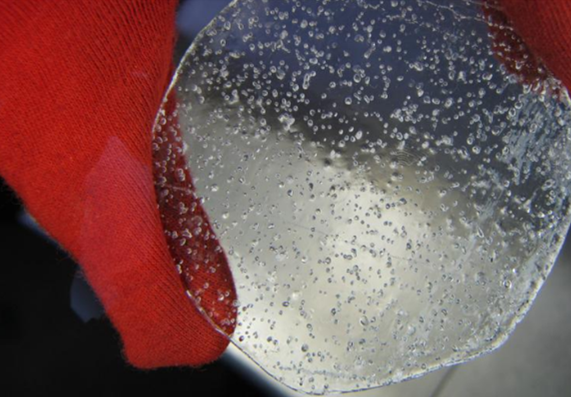
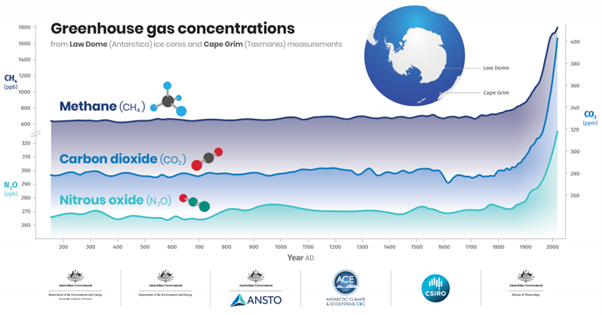
Ice cores can be used to measure past greenhouse gas concentrations, such as carbon dioxide and methane. These gases are trapped in air bubbles in the ice (see photo). Layers of ice can accumulate annually, which means the ice cores trap a record of greenhouse gas concentrations year by year. It is from these concentrations that it is possible to calculate the percentages of different greenhouse gases, including methane. The figure below shows the concentrations of the major greenhouse gases: methane, carbon dioxide and nitrous oxide over the last 2000 years. It is clear that since the 1800s, concentrations have sharply risen and will continue to rise unless we make dramatic changes to reduce emissions.
A great read: Dr Karl’s Little Book of Climate Change Science by Karl Kruszelnicki (2021, ABC Books)
We use carbon accounting to measure or estimate the emissions produced by different emissions sources or activities, such as driving a car or using a computer. Emissions can be direct or indirect. For example, driving a car produces direct emissions from the use of fuel by the car, while using a computer produces indirect emissions from the use of electricity generated at a coal-fuelled power station. Similarly, a piece of paper has associated indirect emissions from the production and transport of the product.
Some emissions are easier to calculate than others. For example, the Australian government provides emission factors to calculate emissions from the use of fuel in vehicles or natural gas at home, as well as electricity. An emission factor is a number that allows you to convert activity data (such as volume of fuel used, or weight of waste generated) into emissions. Emission factors that are relevant to a specific country or region might not be available for all sources of emissions.
There are several online calculators that may help you to calculate emissions from various sources. Some examples are the Carbon Footprint Calculator For Individuals And Households or the ClimateHero Carbon Calculator.
ClimateClever is another app that allows both households and businesses to calculate their carbon emissions, and then suggests ways to reduce these emissions. You can see how this kind of carbon accounting app works here:
This is a really good question! Unfortunately, I do not have the solution to stop wars and bombing... However, it is true that wars produce a lot of pollution, and there are a couple of rules that countries must respect to protect the environment during war time.
One rule prohibits countries at war to damage the natural environment, especially if the damage is expected to be serious. This is because people rely on the environment to survive and be healthy (for food, water, and shelter for instance). Another rule prohibits countries at war from setting forests and other vegetation on fire, to protect plants, animals, and their habitats (where animals live).
Another important rule prohibits countries to use environmental modification for military purposes. This means that countries cannot modify the environment to cause damage to their enemy (by provoking floods, for instance).
All these rules are quite old, and they were agreed on when the protection of the environment was not such an important issue. Now that we know that wars produce a lot of pollution, it may be time for countries to think about updating these rules.
Everyone takes a different path, but the best way is to keep asking questions; at school, at home everywhere! Questions are really the core of science, and as the saying goes, there really aren’t bad one. Asking questions opens doors, makes you meet new people, and leads you down paths you never expected to go down. They don’t even have to be questions about science, per se. It can just be asking how you can get involved.
For me, I started as an engineer in Uni and didn’t really know what I want to do after I graduated. Then one day I asked a professor if there was any research he was doing that I could help with. Lo and behold, he said yes, and now here I am 12 years later, a real life oceanographer and climate scientist. So just remember, it never hurts to ask!