

How have the gases in the atmosphere changed over time?
I’ll focus on the greenhouse gases, the ones that cause climate change, with the main ones being carbon dioxide (CO2), nitrous oxide (N2O), and methane (CH4). Scientists started measuring CO2 in the atmosphere in the late 1950s, collecting flasks of air from a mountain in Hawaii. These measurements are a pretty good indication of CO2 in the whole atmosphere, because the gases in the atmosphere get mixed around quickly and have about the same concentration everywhere. This graph (from here: https://gml.noaa.gov/ccgg/trends/) shows the CO2 measurements from Hawaii:
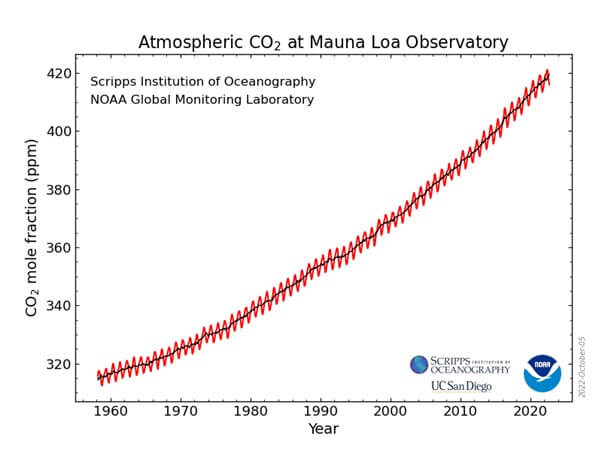
You can see the CO2 concentration has been increasing ever since the measurements started. It was 316 ppm in 1958, 327 ppm when I was born in 1971, 385 ppm in 2007 when my twins were born, and 416 ppm in September 2022. See if you can use the graph to work out what the CO2 concentration was when you were born. There’s an interactive version here: https://gml.noaa.gov/ccgg/trends/graph.html
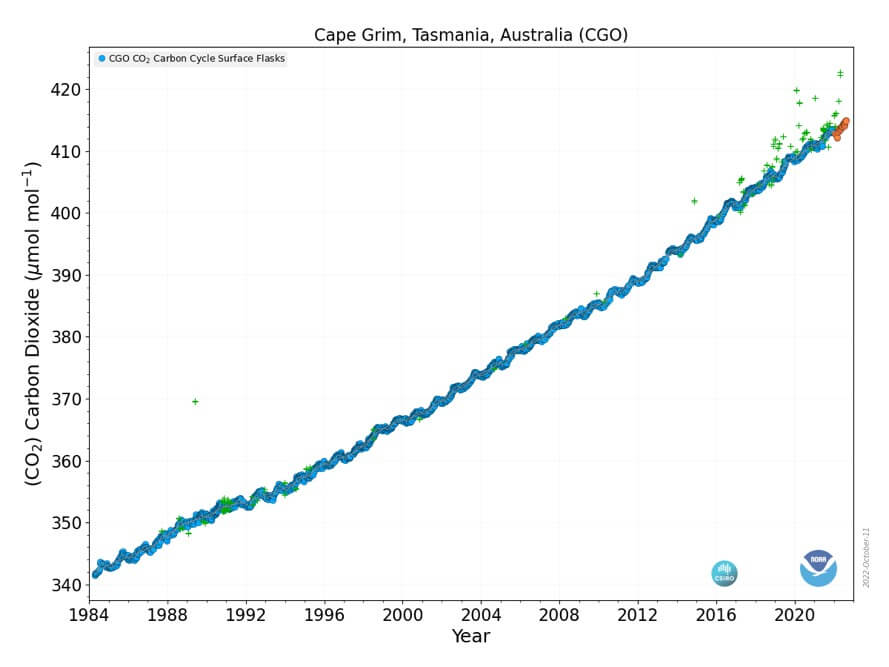
Over time scientists began to make measurements at more places around the world, including in Tasmania. This graph shows CO2 concentration at Cape Grim since 1984:
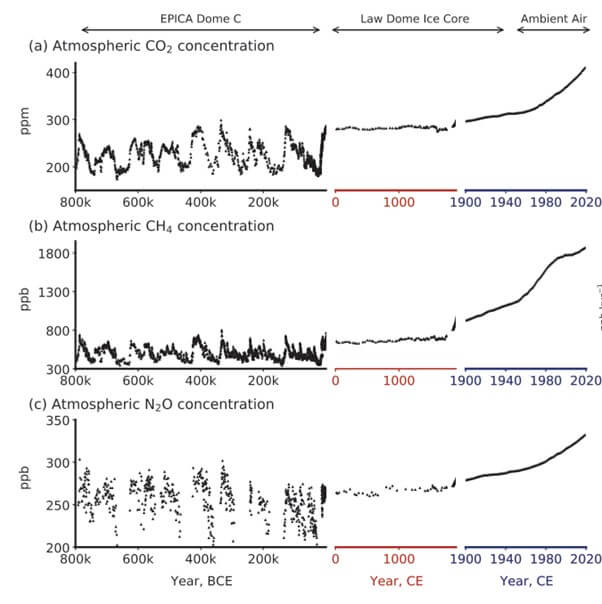
Finally, we even know how gases changed before scientists started collecting samples from mountains. This information comes from bubbles trapped in ice cores, which preserve the air that was around at the time the ice formed. The oldest of these ice samples are 800 thousand years old! The graphs below, from the IPCC 6th Assessment Report, show greenhouse gas concentrations going back 800,000 years. The data on the right-hand side, showing ‘ambient air’, is from flasks like in the graphs above.
What you can see from these graphs is that
- Greenhouse gas concentrations varied quite a lot even when there were no humans around
- Greenhouse gas concentrations have increased very quickly since 1900 (notice that the timescale on the right is expanded compared to the others)
- The concentrations of CO2, CH4 and N2O are higher now than they’ve been at any time in the past 800,000 years.
There is a great animation available on youtube that shows how CO2 in the atmosphere has changed.