

Professor Zanna Chase

Questions answered by this expert
The surface of the earth has warmed by about 1 degree over the last 100 years. We know this because humans have been making measurements of land and ocean temperatures for several hundred years. By carefully combining these measurements and using mathematical methods to fill in gaps, scientists have been able to track how earth’s temperature has changed since about 1850. To be more precise and consistent, climate scientists have agreed to standardise how they talk about warming. So rather than look at 100 years ago, they use the average temperature between 1850 – 1900 as the background starting point. At the other end, the latest reporting compares this starting point to the average temperature from 2011 – 2020. Between those two time periods (which is slightly more than 100 years), our best estimate is that the earth’s surface has warmed by 1.09 degrees. The earth’s surface is made up of land and sea, and if we break it down, we see that the land surface has warmed more than the sea surface- the land has warmed by 1.59 degrees, while the ocean surface has warmed by 0.88 degrees.
We know the most about how Earth’s surface temperature has changed, because that’s where we have the most measurements from. However, other parts of the earth are also warming. In the atmosphere, temperatures have increased throughout the lower part of the atmosphere, known as the troposphere (roughly from the surface to 15 km above). The ocean has warmed down to at least 2km below the surface, although the strongest warming is at the ocean surface.
What this all means for us is a great question. First, global surface temperatures might not mean that much to us, as we only live in one place. The data for Tasmania, compiled by the Bureau of Meteorology (you can have a look at graphs here) show that Tasmania has followed the global trend pretty closely, and has warmed by about 1 degree over the last 100 years. 1 degree of warming doesn’t sound like very much- after all, a high of 18 is not that different from a high of 17. Certainly in Tasmania this temperature rise hasn’t pushed us to the edge of what the human body can endure. But a rise in temperature is associated with other changes, to things like bushfires, droughts, floods and the movements of plants, animals and even diseases. These have all changed over the past 100 years and we’re still studying how much, how this has affected us and to what extent the changes can be attributed to climate change.
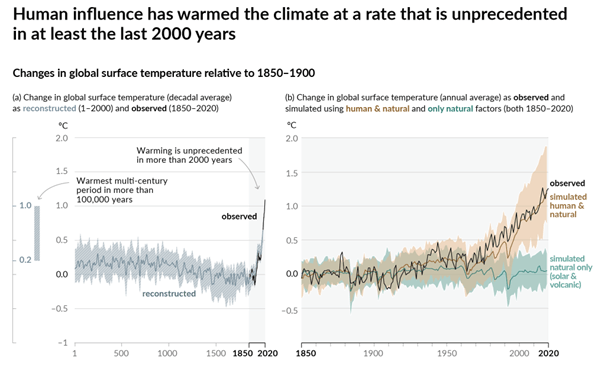
Another thing this means for us is how our ability to explain the temperature change that has occurred gives us confidence that as scientists we have quite a good understanding of how climate works. The graph below shows that the observed warming (black line) is reproduced quite well by climate models, but only if the models include human (red and blue) and natural (green) causes- the natural causes alone can’t reproduce the temperature rise that’s occurred over the last 100 years. This means we can trust the predictions made by the climate models, and this trust should give us confidence to take action to prevent the worst outcomes.
I’ll focus on the greenhouse gases, the ones that cause climate change, with the main ones being carbon dioxide (CO2), nitrous oxide (N2O), and methane (CH4). Scientists started measuring CO2 in the atmosphere in the late 1950s, collecting flasks of air from a mountain in Hawaii. These measurements are a pretty good indication of CO2 in the whole atmosphere, because the gases in the atmosphere get mixed around quickly and have about the same concentration everywhere. This graph (from here: https://gml.noaa.gov/ccgg/trends/) shows the CO2 measurements from Hawaii:
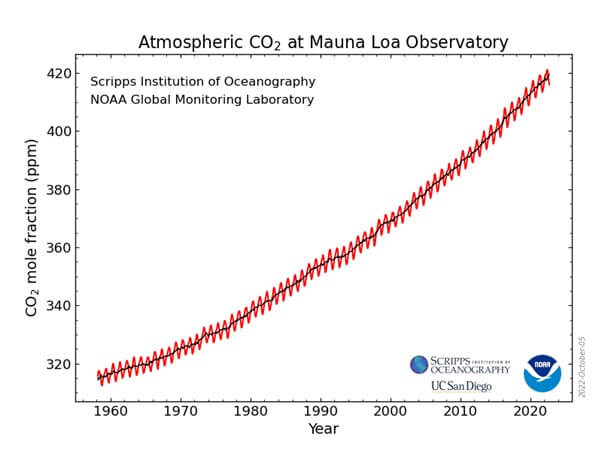
You can see the CO2 concentration has been increasing ever since the measurements started. It was 316 ppm in 1958, 327 ppm when I was born in 1971, 385 ppm in 2007 when my twins were born, and 416 ppm in September 2022. See if you can use the graph to work out what the CO2 concentration was when you were born. There’s an interactive version here: https://gml.noaa.gov/ccgg/trends/graph.html
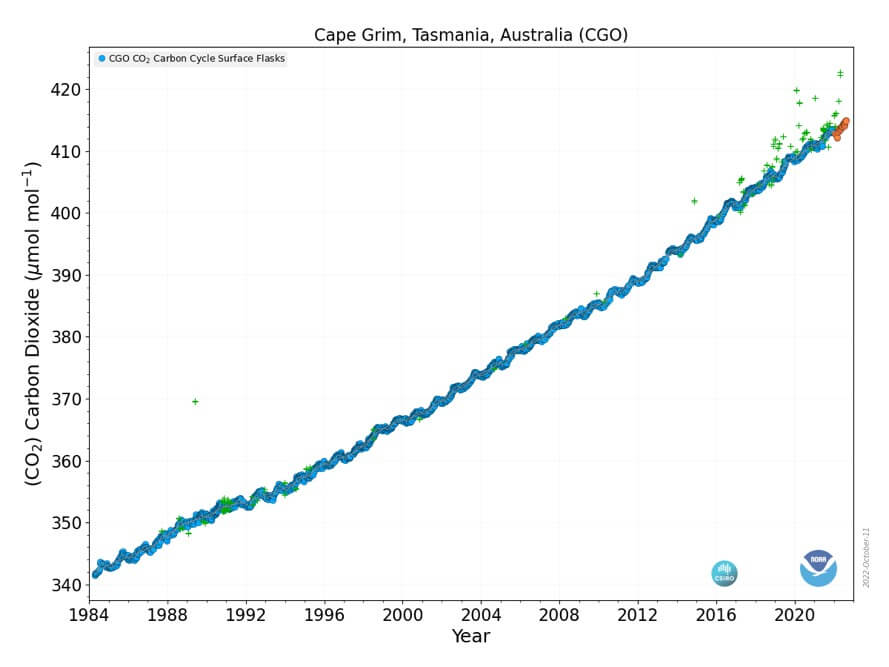
Over time scientists began to make measurements at more places around the world, including in Tasmania. This graph shows CO2 concentration at Cape Grim since 1984:
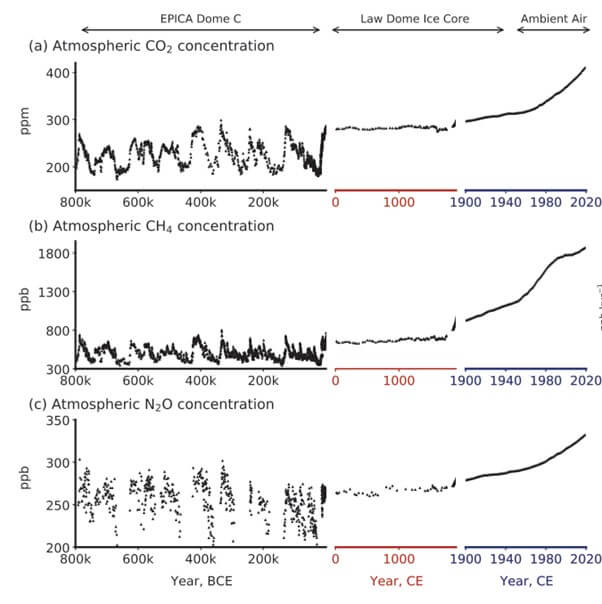
Finally, we even know how gases changed before scientists started collecting samples from mountains. This information comes from bubbles trapped in ice cores, which preserve the air that was around at the time the ice formed. The oldest of these ice samples are 800 thousand years old! The graphs below, from the IPCC 6th Assessment Report, show greenhouse gas concentrations going back 800,000 years. The data on the right-hand side, showing ‘ambient air’, is from flasks like in the graphs above.
What you can see from these graphs is that
- Greenhouse gas concentrations varied quite a lot even when there were no humans around
- Greenhouse gas concentrations have increased very quickly since 1900 (notice that the timescale on the right is expanded compared to the others)
- The concentrations of CO2, CH4 and N2O are higher now than they’ve been at any time in the past 800,000 years.
There is a great animation available on youtube that shows how CO2 in the atmosphere has changed.
Earth’s climate has been changing since it was formed. Sometimes the climate changed quickly, other times more gradually, but there has always been climate change. Before humans this was caused by natural factors such as the strength of the sun, volcanic activity, even meteor impacts. For example, at the time of the dinosaurs, 250 – 65 million years ago, the global climate was hot and humid. Over the past million years, the Earth has gone through cycles of ice ages, where Earth’s surface temperature warmed and cooled by about 5 C every 100,000 years.
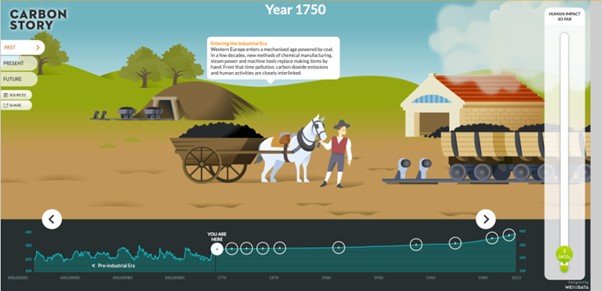
But if we ask: “how long has climate change caused by humans been around?” most scientists agree this started around the time human activity began to produce a lot of carbon dioxide. This happened about 200 years ago, at the start of what’s known as the Industrial Era. This is when coal-powered mechanical devices replaced human and animal labour and at the same time the number of humans on earth increased rapidly. Together these changes led to humans emitting more and more carbon dioxide into the atmosphere, and the beginning of human-caused climate change. Some scientists have argued that the earth was headed for another ice age around now, but the carbon dioxide produced by humans starting in the 1800s prevented this.
The screenshot below is from the Global Carbon Atlas. This is an interactive site that shows how human impact on the climate has changed through time- worth checking out. http://www.globalcarbonatlas.org/en/outreach (click on Enter the Past).
Finally, the graphs below can help you work out when climate change caused by humans started. The left-hand graph shows how global temperatures have changed over the last 2020 years. The right-hand side zooms in on the time since 1850 (when the temperatures are based on direct observations using thermometers). It compares the observed climate change (black line) with climate change simulated from a model that includes only natural factors like changes in the sun and changes in volcanic activity (green line), with climate change simulated by a model that includes both human and natural factors (orange line). The black line of the observations follows the orange line quite well, but both of them pull away from the green line starting around 1950. From this we can say that the climate change caused by humans has been around since at least 1950.